Project Data Overview
Overview
A visual overview of the data contents of a p:IGI+ project can be found using the Project Data Overview feature.
Version: 1.7.2 and 1.9.0.6 (Aug 2017, Jan 2018)
Usage: Data --> New project data overview...
How to use in practice
Project Data Overview
A new Project Data Overview can be created to see data population density within data pages and/or discover data relations across several pages for a single sample.
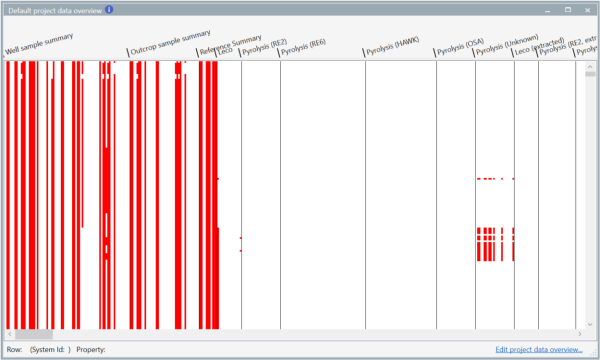
Once created by assigning a name to the data overview artefact (you can have more than one instance of the data overview to preview different aspects of the project database) red pixels indicate a cell within the database containing a data value. Clicking on a pixel will provide information relating to the property possessing the data and the location (Row number and System Id) of the sample in the database.
For Molecular & Gas properties which have property indicators, the overview presents the presence of data attached to the property, but does not detail for which indicator/s data exists.
Once created project data overviews are listed in the respective folder in the Artefact manager and are dynamically responsive to data modifying features such as data Sort.
Modifying Data Overview
Given the extensive scale of the p:IGI+ property model it would be impractical to view all the pages and all related properties in one overview instance. Select the Edit project data overview... link at the bottom of the overview window to customise which pages and the order in which the pages are shown on the project data overview.
Pages can be easily added or removed within the dialogue using either the arrow buttons or single / multi page select and ordered through drag and drop.
Sample Sets can be applied to a project overview, focusing the scope of the overview against a specific subset of the data.
© 2026 Integrated Geochemical Interpretation Ltd. All rights reserved.