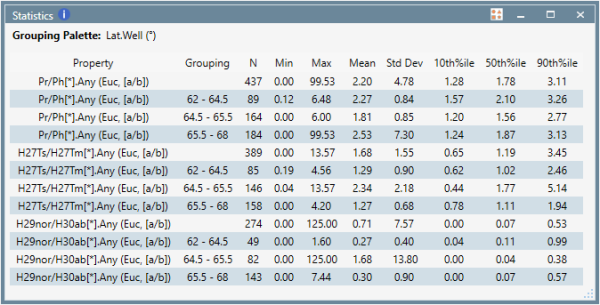
Summary statistics
Overview
The Statistics artefact provides a statistical summary of the data present in a project. Statistics will be computed for the selected properties, and this can be combined with a palette to produce grouped (stratified) statistics. A sample set can be applied to restrict the calculations to a subset of the data. This provides a means to effectively summarise and extract trends from data sets.
Version: p:IGI+ 2.5+ (Sep 2024)
Usage: Statistics --> New summary statistics...
How to use in practice

Data properties from the p:IGI+ property model can be combined with a single Palette (Colour, Size or Shape) and/or a single Sample set (either Dynamic or Static) and/or a single Well Sample set (if not already an Expression in the sample set Query) to provide a means to effectively summarise and extract the significance from large data sets.
The Statistics artefact reports:
- N - The number of observations
- Min - The minimum value
- Max - The maximum value
- Mean - The average, or expected, value
- Std Dev - The amount of variation or dispersion (square root of the variance)
- 10th%ile - The value below which 10% of the observations occur. In the oil and gas industry, when risking this is often referred to as the "P90" value - which is equivalent, and is interpreted to mean the value above which 90% of the values occur.
- 50th%ile - Also called the ‘Median’, the middle value
- 90th%ile - The value below which 90% of observations occur. In the oil and gas industry, when risking this is often referred to as the "P10" value - which is equivalent, and is interpreted to mean the value above which 10% of the values occur.
- IQR - A measure of the statistical dispersion, equal to the difference between the 75th%ile and the 25th%ile
- Kurtosis - Kurtosis is a measure of whether the data are heavy-tailed or light-tailed relative to a normal distribution. Data sets with high (positive) values indicate data have heavy tails or outliers, low (negative) values indicate data have light tails, or lack outliers
- Skewness - A measure of symmetry, or more precisely, the lack of symmetry. The skewness for a normal distribution is zero, negative values indicate data are skewed left, positive values indicate data are skewed right
Properties to be included in the statistical summary can be chosen through the Add/Remove Properties link at the bottom of the dialogue window and the subsequent use of the standard Property Selector. When using properties which have associated indicators [Gas and Molecular] use the Bulk Update Properties link to interchange between different indicator groups.
Any application of palettes, samples sets or well sample sets to a statistics artefact will see the summary data revise itself automatically. A progress bar is provided where large numbers of properties or groupings are present.
When a palette is applied to the statistical dialogue the data is automatically sub-divided by individual palette entry - this provides you with an easy way to group or stratify your statistics. Once grouped the data display can be ordered by either:
- Reorganising the summary data, separating the data on grouping (Palette entries) instead of property
- Hiding rows with no data
An alternative to hiding all rows with no data, is to control the groupings which are visible through the palette (often called 'stratified statistics'). This is achieved by opening the applied palette from the statistics window (double click the appropriate icon in the top right of the dialogue window) and hiding the palette entries not wished to be seen.
For easy reporting, a record of the statistical summary can be copied to the clipboard and transferred to other applications.
In p:IGI+ the user can create as many occurrences of a statistical summary as they wish. In addition created summaries can be saved externally as an artefact template through Right Click --> Export As Template... for use in other projects or to send to other users.
From version 2.2 it is possible to customise the statistics shown on the artefact using the Edit the statistics shown... link.
From version 2.5 the statistics view has been improved to allow them to work well when applied to a dashboard this includes being able to transpose (swap row-columns) statistics to show summary information efficiently, controls have been moved to the right click options to clean up the presentation of key information and the filter summary is used to show if any sample sets are applied.
© 2025 Integrated Geochemical Interpretation Ltd. All rights reserved.
