Graph Interpretative Layers
Overview
Graph interpretative layers (overlays and underlays) provide geochemical context and meaning to the plotted data.
Version: 3.0+ (Apr 2026)
Usage: Graph Manager Layout Tab
How to use in practice
Graph Interpretative Layers
Enter the Graph Manager Layout tab to control and customise the visual appearance of the graph. This route also provides access to the associated Graph layer edit modes where appropriate by clicking the associated icon. Layers can also be entered by right-clicking on the graph and selecting the relevant overlay or underlay editor.

Here we explore the following Graph Layer options:
- Image Underlay - A transient import layer of a graph image to assist in the creation of Overlay and Underlay objects.
- Overlay - A layer which appears in front of the plotted data. This layer can be composed of a variety of drawing objects including text, line, arrow and polygons.
- Underlay - A layer which appears under the plotted data. This layer can be composed of a variety of drawing objects including text, line, arrows, and polygons.
- Range Underlay - A layer which appears under the plotted data. Covering the entire extent of the x-axis, with no vertical limit, this layer can be split vertically into bins of definable width.
Image Underlay
Once in image underlay editing mode, select Add to pick and define the graph image that will aid in creating Overlay and Underlay objects on a graph.
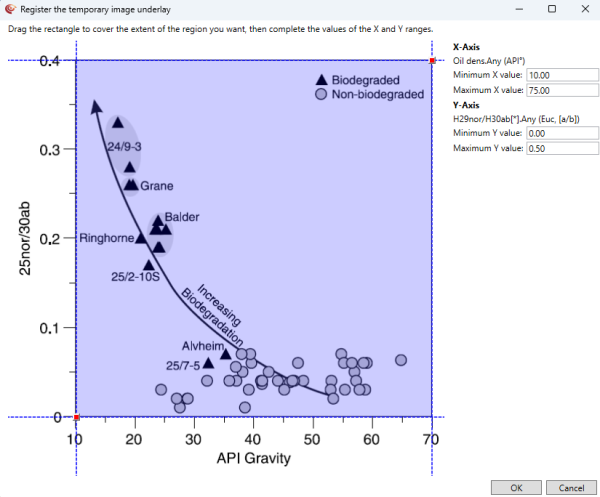
Fig: Import of an image underlay
Drag the red square anchor points to the corner extents of the graph to define the shaded region that will be imported. Ensure the values in the minimum and maximum X & Y cells match the values on the import graph image, corresponding with the corners of the shaded blue region. Once ready, OK to import the image. Review the underlay placement and then click Done to exit the image underlay dialogue.
An image underlay can be added to scatter plots, tri-plots, depth plots & single-track multi-depth plots.
Re-enter the Image Underlay Editor, right-click on the image and hit Delete once finished creating/editing the over/underlay layer items. Hit Done to exit.
Over / Underlays
Enter the Overlay or Underlay Editor and resize the screen to clearly see the graph. A selection of drawing objects is available to create interpretative zones on the graph.

- Line - click once on the graph to define the object length by defining each endpoint.
- Rectangle - click once on the graph to define the object size by defining opposite corners.
- Polyline - a polyline is a line composed of several joined line segments, each defined by two anchor points. After the 2nd click, the first segment line will appear, and then each subsequent segment will appear 1 click later. Right-click and select End when all segments are present.
- Polygon - a polygon is an enclosed shape composed of several joined line segments. After the 2nd click, the first enclosed segment will appear, and then it will enlarge with each additional click. Right-click and select End when all segments are present.
- Ellipse - click once on the graph to define the object size by defining opposite corners of a square, which the ellipse would fit into.
- Polycurve - a polycurve is a line composed of several curved line segments, each defined by four anchor points. After the 4th click, the first segment curve will appear, and then each subsequent segment will appear 3 clicks later. Right-click and select End when all segments are present.
- Text - click once to define the top-left corner of the text string. The text is written and styled in the left-hand menu.
- Arrow - click once on the graph to define the object length by defining each endpoint.
Resize items: Once created, resize items by using the corner blue square anchors
Reposition items: Once created, reposition entire items using the central red square anchor.
Rotate items: Once created, rotate items using the green square anchor
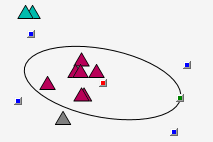
Fig: Object controls
With the drawing object created and selected in the left-hand list, a host of object edit options appear on the left-hand side of the edit window, such as fill / line colour, line width etc.
There is also an option to provide a Legend label (appears when Show in Legend is selected from the top of edit layer options and the Legend is displayed from the Graph Manager Layout tab properties list)
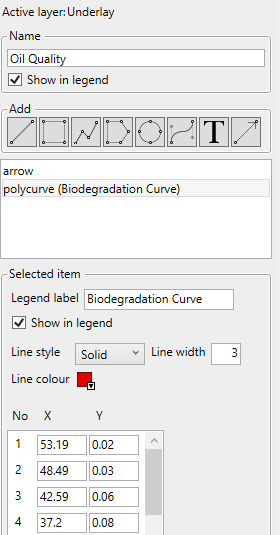
Fig: Layer item additional options menu
© 2026 Integrated Geochemical Interpretation Ltd. All rights reserved.