Dashboards
Overview
Dashboards allow the creation of complex arrangements of graphs, maps and bar charts / box and whisker plots
Version: pIGI+ 2.5+ (Sep 2024)
------------------------------------------------------------------------------------------------------------
Usage: Artefact--> New dashboard...
------------------------------------------------------------------------------------------------------------
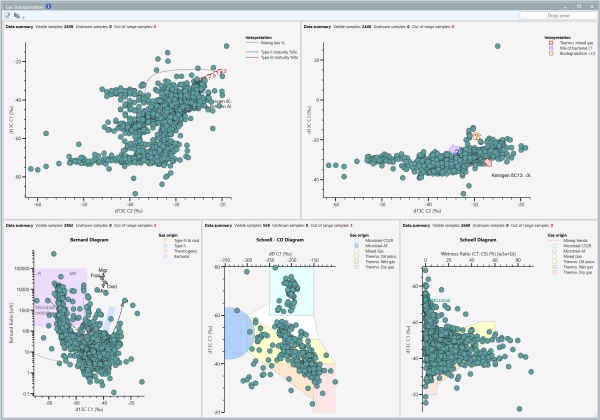
We have introduced the concept of a ‘dashboard’, allowing the user to create complex arrangements of graphs, maps and bar charts / box and whisker plots. To create a new dashboard select Artefact --> New dashboard... which will bring up a list of your current auto-dashboards and select the custom dashboard option allowing you to create a new empty dashboard layout, and set its content layout and name.

Users can add graphs, maps and statistics artefacts to dashboards and the artefacts on them are fully interactive to brushing, pan zoom etc. Palettes and sample sets can still be applied to individual artefacts when they are on a dashboard and can be applied to all artefacts on the dashboard at once by being dropped onto the ‘Drop zone’ on the dashboard toolbar or the 'Apply to all open artefacts' right click option. Underlays and overlays can be edited in place on dashboards, although we do not recommend doing this due to the limited space available.
The dashboard editor allows the user to customise the layout of the panels and can be configured to have a maximum of 4 by 4 panels including catering for non-regular dashboards.
Artefact information can be added and saved to dashboards within its template and auto-dashboards are supported and will list the artefacts applied to them in the preview.
© 2026 Integrated Geochemical Interpretation Ltd. All rights reserved.
